Beer Syndicate Blog

Shamelessly Promoting Beer

Month: February 2018

Data Chug: Analysis of BeerAdvocate’s Top 250 Beers

Today, we attempt to answer exactly 16 questions based on BeerAdvocate’s Top 250 rated beers.

Intro complete, now on with the Q & A…

Q1. When we talk about “the Top 250 beers,” exactly how much competition was there? In other words, how many beers did the Top 250 beat out? Like 1,000 other beers? 2,000 other beers?

A1. Close. There were 210,023 beers listed on BeerAdvocate as of February 2018, so the Top 250 beat out 209,773 other beers. This means that the Top 250 represent the top 0.12% of all beers listed on BeerAdvocate. Not too shabby.

Q2. Talk about cream of the crop. Here’s an easy question: Which beer was # 1?

A2. That is an easy question. The highest rated beer in the Top 250 was Kentucky Brunch Brand Stout, which is a 12% ABV American Imperial Stout from Toppling Goliath Brewing Company.

In case you’re interested, here are the rest of the beers just in the Top 10 based on score:

Tied for 2nd place were:

Hunahpu’s Imperial Stout – Double Barrel Aged – Cigar City Brewing
Barrel-Aged Abraxas- Perennial Artisan Ales
King Julius – Tree House Brewing Company

Tied for 3rd were:

Marshmallow Handjee (Bourbon Barrel Aged Vanilla Bean Dark Lord) – 3 Floyds Brewing Co.
Drie Fonteinen Zenne Y Frontera – Brouwerij 3 Fonteinen
Barrel Aged Imperial German Chocolate Cupcake Stout- Angry Chair Brewing
Heady Topper – The Alchemist Brewery and Visitors Center

Tied for 4th were:

Very Hazy – Tree House Brewing Company
Fundamental Observation – Bottle Logic Brewing

BeerAdvocate recently adjusted its ranking algorithm to adjust for how many reviews of a given beer there were.  Based on that update, the Top 10 list was as follows:

1. Kentucky Brunch Brand Stout – Toppling Goliath Brewing Company
2. Heady Topper – The Alchemist Brewery and Visitors Center
3. Hunahpu’s Imperial Stout – Double Barrel Aged – Cigar City Brewing
4. Barrel-Aged Abraxas – Perennial Artisan Ales
5. Marshmallow Handjee (Bourbon Barrel Aged Vanilla Bean Dark Lord) – 3 Floyds Brewing Co.
6. King Julius – Tree House Brewing Company
7. Pliny The Younger – Russian River Brewing Company
8. Bourbon County Brand Coffee Stout – Goose Island Beer Co.
9. Fundamental Observation – Bottle Logic Brewing
10. Mornin’ Delight – Toppling Goliath Brewing Company

You can see the entire list here.

Q3. Huh, seems like big boozy stouts and Double IPAs dominate the Top 10. Can’t say I’m surprised. Speaking of which, what are the most popular beer styles in the Top 250?

A3. Keen observation… and get ready to be not surprised again. As you can see in the handy chart below, it turns out that the two most represented beer styles in the Top 250 were American Double IPA at 26% and American Imperial Stout at 23.6%. Together, those two beer styles make up nearly half of all beer styles in the Top 250.

[Click on any chart to magnify.]
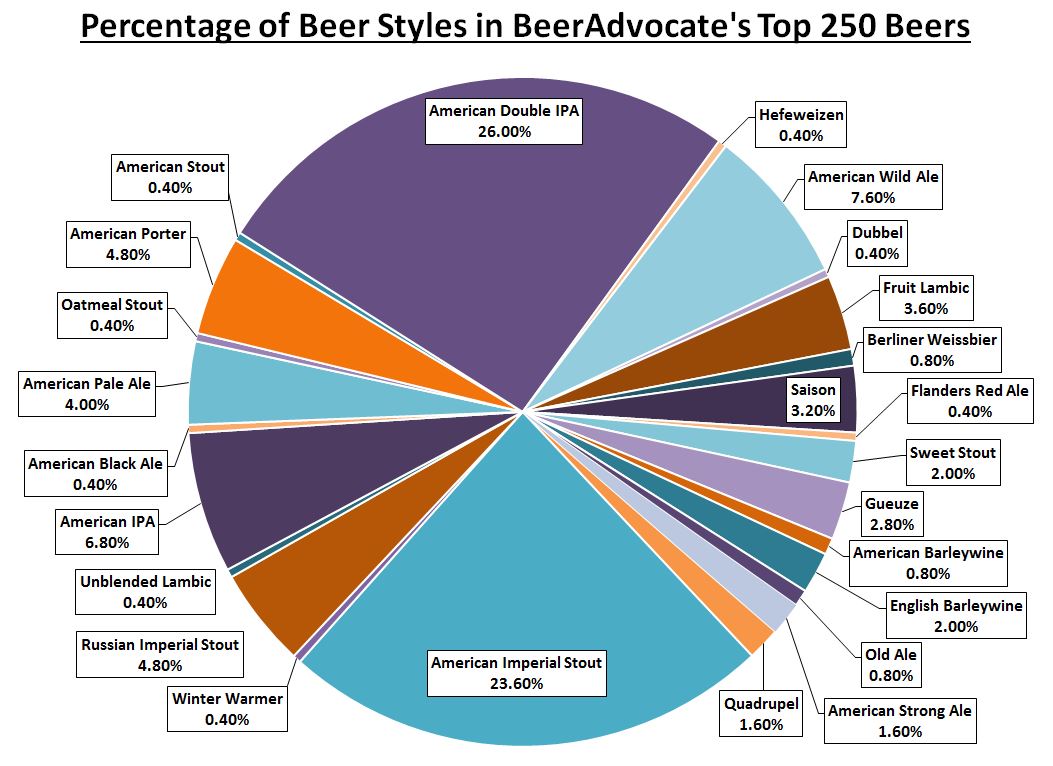
The eight next most popular beer styles in the Top 250 after Double IPA and Imperial Stout were American Wild Ale (7.6%), American IPA (6.8%), Russian Imperial Stout (4.8%), American Porter (4.8%), American Pale Ale (4%), Fruit Lambic (3.6%), Saison (3.2%), Gueuze (2.8%), Sweet Stout (2%) and English Barleywine (2%).

In a six-way tie for the least represented beer style in the Top 250 with only one example from each category, you have Flanders Red Ale, Belgian Dubbel, German Hefeweizen, American Stout, Winter Warmer and Unblended Lambic.

Q4. Got it. So if you want to be in the Top 250, then it helps if you’re brewing big boozy stouts and Double IPAs. Sounds like a plan. Speaking of beer styles, I’m curious, how many beer styles are there in total?

A4. Well, BeerAdvocate lists a total of 104 different beer styles, and of those 104, only 25 were represented in the Top 250, which were largely dominated by… you got itDouble IPAs and Imperials stouts. There are definitely more beer styles out there than those that appear on BeerAdvocate’s list, but as the greatest comedian of all time, Larry the Cable Guy, once said: it is what it is.

Q5. Obviously Kathy Griffin is the greatest comedian of all time, but back to beer. It seems like the most popular beer styles (American Double IPA & American Imperial Stout) just so happen to be a bit on the boozy side. Do you have any data that shows how alcoholic the beers in the Top 250 are?

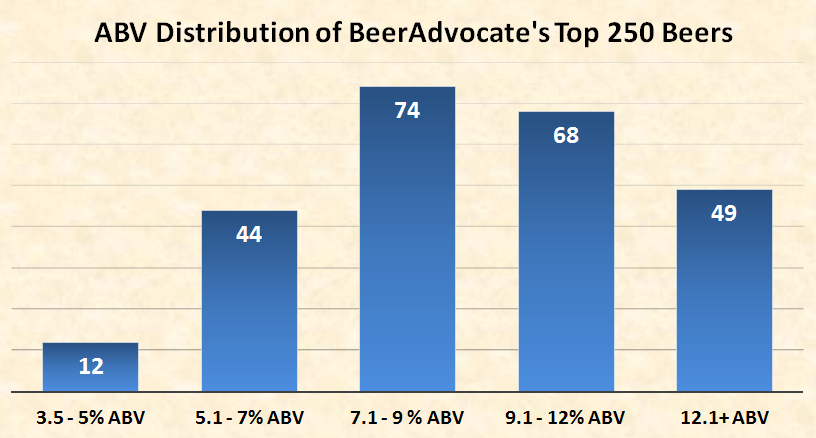
A5. Fancy that you ask. We actually did take a look at the ABV distribution of the Top 250 beers, and you are correct in your suspicion that they tend to be a bit alcohol-friendly as you can see in the chart below:

ABV Distribution of BeerAdvocate's Top 250 Beers

Turns out that the average ABV of all the beers in the Top 250 is 9.6%. In the spirit of thoroughness, two of the beers in the Top 250 didn’t have an ABV listed, but seeing as how one of those beers was an Imperial stout and the other an English Barleywine, it’s probably safe to say they didn’t bring the average ABV down.

Q6. Booze sells I guess. I noticed that the top two beer styles (American Double IPA & American Imperial Stout) are, as their names suggest, American styles of beer. Can you tell me how many beers in the Top 250 are from American breweries?

A6. Another good question. Of course, brewing a certain beer style isn’t country-specific, meaning that basically any country can brew any beer style it wants— Well, with the questionable exceptions of the quasi-protected appellations of Old Gueuze and Kölsch which allegedly can only be brewed in Belgium and Cologne respectively, but who’s counting.

Anyways, the point was that just because the top two beer styles happen to be American styles, doesn’t necessarily mean they came from American breweries. But that fact had minimal impact in this case. Only 5 out of the 124 American Double IPAs and Imperial Stouts in the Top 250 were brewed by non-American breweries (2 from Canada and 3 from Denmark to be specific).

Q7. Fair point, but you didn’t exactly answer the question about how many American-brewed beers there were in the Top 250. How about you just tell me how many beers in the Top 250 came from whichever countries.

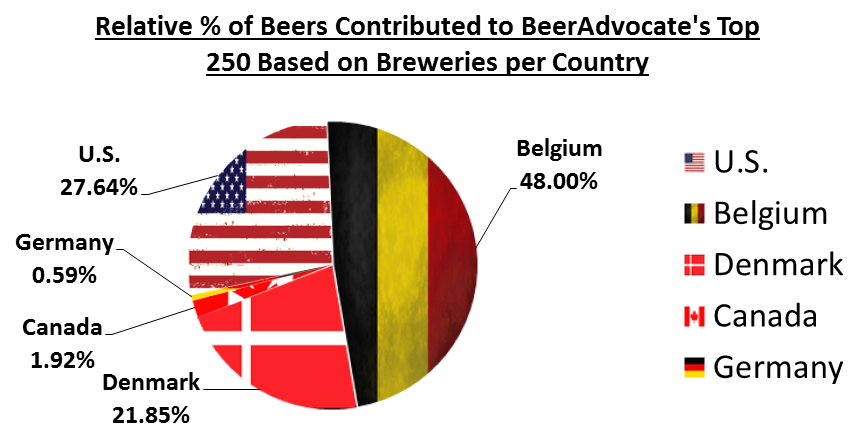
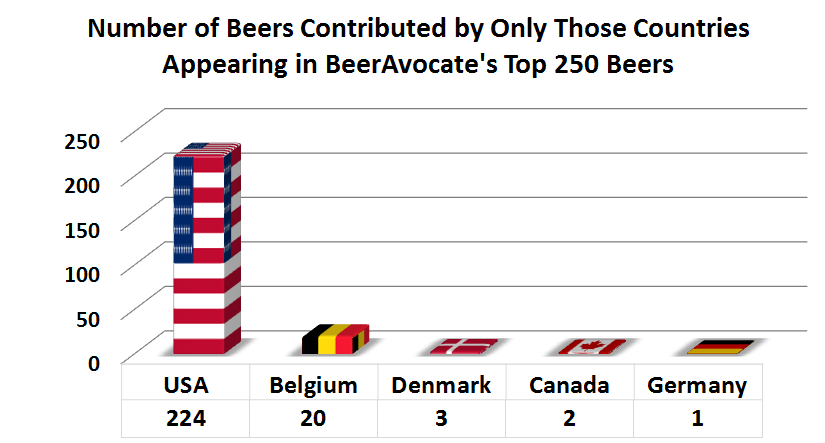
A7. We’ll do better than tell you, we’ll show you! And also tell you. As the country-coded 3-D chart below shows, 224 of the Top 250 came from the U.S. After that, Belgium came in second with 20, followed by Denmark with 3, Canada at 2, and Germany with a grand total of 1. In other words, American-brewed beers represented 89.6% of all beers in the top 250.

# of Beers Contributed by Only Those Countries Appearing in BeerAdvocate's Top_250 Beers

On a side note, 55.87% of all beer styles in the top 250 were American styles. So if 89.6% of beers in the top 250 came from the U.S., this seems to suggest that American breweries are beating other countries at their own game.

Q8. Geez, it looks like the U.S. is really crushing it when it comes to beer. I wonder if the number of breweries in each country has something to do with it. I mean if there are more breweries in the U.S., that might increase the chances of American-brewed beers appearing in the Top 250, right?

A8. You might be on to something. There are 6,731 breweries in the U.S., followed by Germany with 1,413, Canada at 863, Belgium with 346, and Denmark with 114.  Here’s a chart that show’s the percentage of beers contributed to the Top 250 relative to the number of breweries per country:

Q9. Okay, the U.S. isn’t # 1 anymore after looking at the numbers proportionate to the number of breweries there are per country. But I’m still interested to see how the individual states in the U.S. did comparatively. Got anything for me?

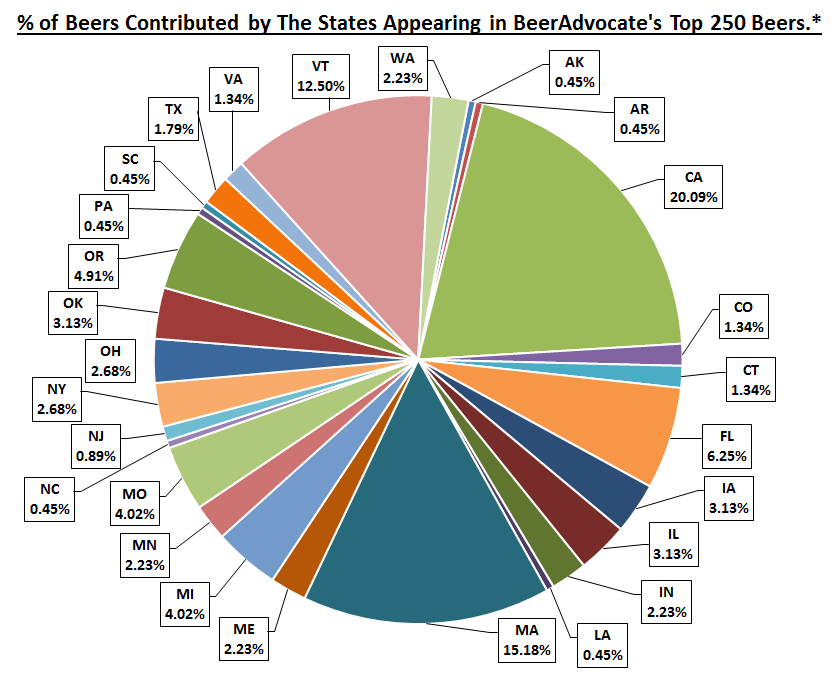
A9. How’s about a big fat color-coded pie chart breaking down the percentage of beers in the Top 250 from each state. And yes, we excluded non-American contributions from the chart… that’s what that little asterisk at the title of the chart is about.

% of Beers Contributed by The States States Appearing in BeerAdvocate's Top 250 Beers.

As you can see above, there are 27 states with beers in the Top 250. The states with the most beers in the top 250 were California with 45, Massachusetts with 34, Vermont at 28, Florida with 14, and Oregon with 11.

Q10. Yeah, of course there’s going to be more beers in the Top 250 from California because California has the most breweries in the U.S. So how would things look if you adjusted the numbers relative to the number of breweries per state?

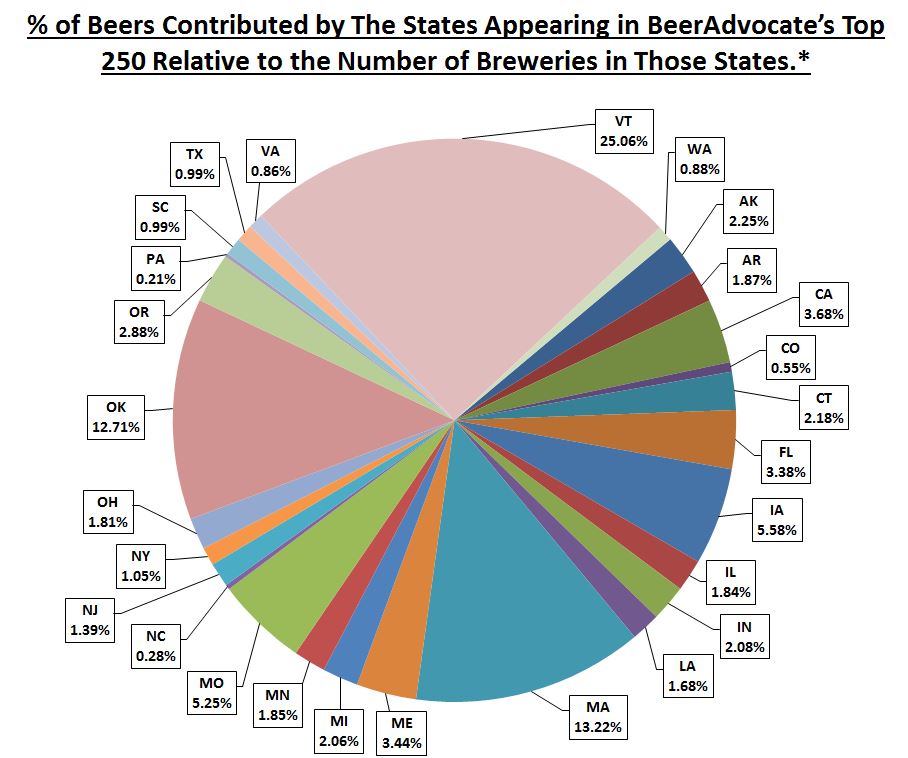
A10. Below is a chart that shows the percentage of beers contributed by each state that appears in the Top 250 relative to how many breweries there are in those respective states:

% of Beers Contributed by the States Appearing in BeerAdvocate’s Top_250 Based on the Number of Breweries in Those States.

So, as you can see, once you account for the total number of breweries in each state per number of beers in the Top 250, it turns out that California is no longer number one. It’s not even in the top 5. The new picture looks like this: Vermont in first place with 25.06%, followed by Massachusetts at 13.22%, Oklahoma with 12.71%, Iowa at 5.58%, Missouri with 5.25%, and then California with 3.68%.

Q11. Ok, so you relativized the data according to the number of breweries in each state, but not all breweries produce the same number of beers. Can you relativize these numbers based on how many beers are produced by each state?

A11. Let’s see, so there’re 800 breweries in California alone, and 4,661 breweries in the other 26 states in the Top 250, so… uh, this is gonna take a while. We’ll get back to you on that one.

Q12. Alright, maybe I was getting a little greedy with that question. Just for fun though, how many beers were contributed by each region of the U.S., according to how the U.S. Census Bureau defines the regions, of course.

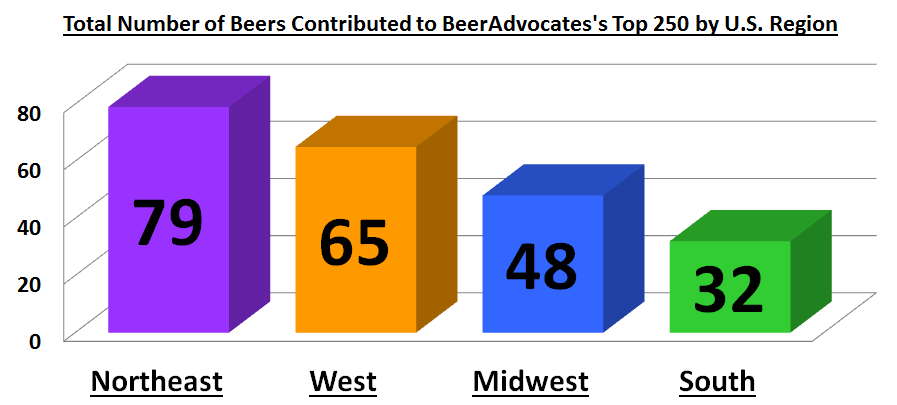
A12. Obviously we were going to use the U.S. Census Bureau method for defining regions of the U.S. That’s like the gold standard, or whatever standard the U.S. is pinning the value of its currency to nowadays. Anyways… here’s another chart. With colors. And shapes.

Total Number of Beers Contributed to BeerAdvocates's Top 250 by U.S. Region

Here’s that same information in a non-chart format:

U.S. Regions:

West: CA: 45, CO: 3, AK: 1, OR: 11, WA: 5 = 65
Midwest: IA: 7, IL: 7, IN: 5, OH: 6, MI: 9, MN: 5, MO: 9 = 48
South: AR: 1, FL: 14, LA: 1, NC: 1, OK: 7, TX: 4, SC: 1, VA: 3: = 32
Northeast: CT: 3, MA: 34, ME: 5, NJ: 2, NY: 6, PA: 1, VT: 28: = 79

Q13. You know, here I am asking all these questions about the different states and beer styles, I forgot to ask about the breweries themselves. Were there many breweries with more than one beer to make it into the Top 250?

A13. Yes. In fact, there were only 86 breweries contributing beers to the Top 250, which means there were several, or more specifically 45, breweries with more than one beer in the Top 250. The average number of beers contributed by only those breweries in the Top 250 was 2.91.

Q14. Okay, so 2.91 was the average. Were there any outlier breweries on the list? Like breweries with a statistically high number of beers in the Top 250?

A14. So this is where things are about to get a bit more interesting. To answer your question, yes, there were a few outlier breweries in the Top 250. To keep things in prospective, remember that there were 210,023 beers listed on BeerAdvocate when we ran the numbers mid-February of 2018, so for a single brewery to have multiple beers in the Top 250 is pretty impressive on its own.

But if you’re asking for extreme outliers, there were two breweries in particular that caught our eye.

Hold on to your hat because both Hill Farmstead Brewery and Trillium Brewing Company each had 20 beers in the top 250. Them’s what we call some significant outliers.

Q15. 20 beers each?!? Seems like a WTF is in order. Tell me you guys dug into those curious sounding numbers a little bit more, right?

A15. Yep. But to get that information, you’ll have to pay us money. Just kidding! As Bill Gates once said, information and all the time it takes to compile and analyze should be free! So in the spirit of the Freedom of Information Act, we’re going to share those juicy details with you free-of-charge.

But first, you see that big cliff right over there?

Q16. Which cliff?

A16. The cliff you’ll have to hang onto until next time.

Next on Tap: Data Chug: The Outlier Breweries in BeerAdvocate’s Top 250


Hi, I’m Dan: Beer Editor for BeerSyndicate.com, Beer and Drinking Writer, Award-Winning Brewer, BJCP Beer Judge, Beer Reviewer, American Homebrewers Association Member, Shameless Beer Promoter, and Beer Traveler.

Data Chug: Analysis of The Most Popular Beer Styles in the World

What is the most and least popular beer style in the world in terms of number of commercial examples?  Which type of beer is more popular: lager or ale?  Which country has contributed most to the number of beer styles in the world?

To attempt an answer at these questions and more, we analyzed data from the popular beer rating website BeerAdvocate and provided the results below.

A Word About BeerAdvocate

As mentioned, BeerAdvocate is an online beer rating site among other things.  As of this writing, the website has a database of 210,023 different commercial beers and counting, all of which are categorized under one of the existing 104 different beer styles as listed and defined by the site.  BeerAdvocate clearly indicates on its website that its list and definitions of beer styles “is not the bible for beer styles, but should be viewed as a work-in-progress and a fun reference that’s open to change and interpretation.”

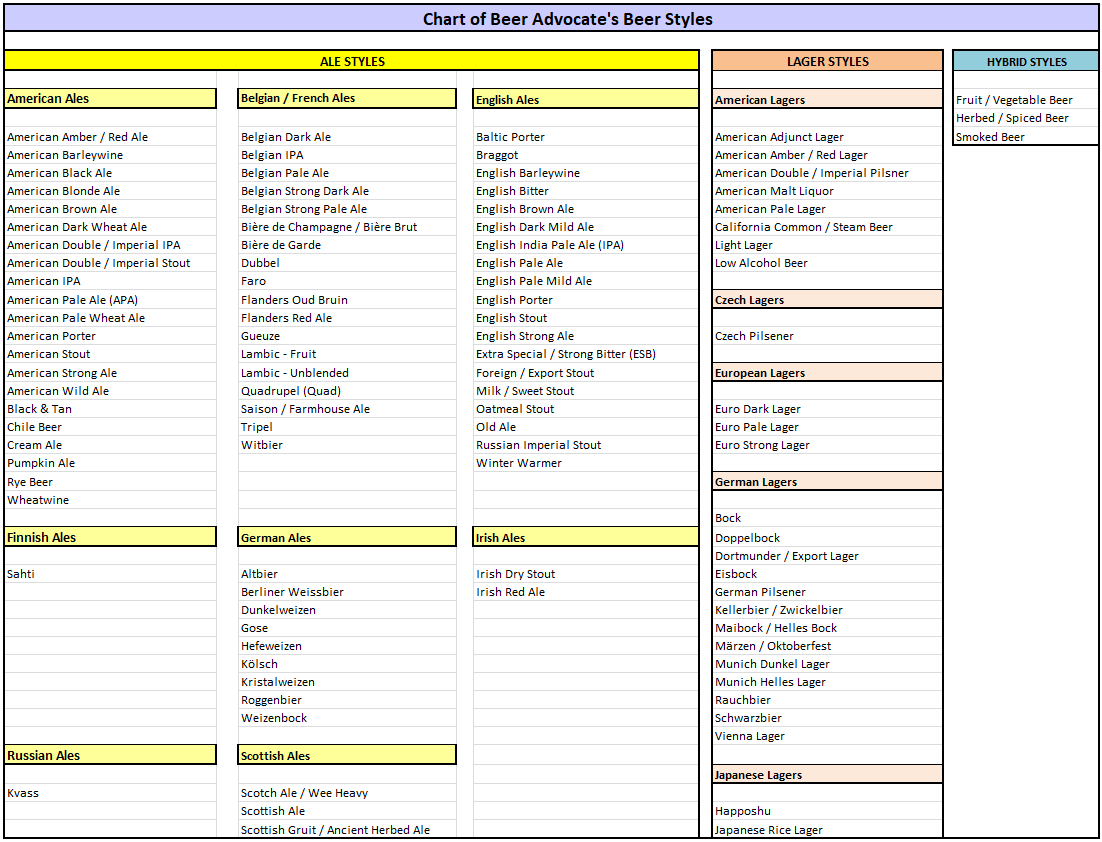
That said, BeerAdvocate arranges all of the beer styles it’s identified under three main categories: ale, lager and hybrid, as shown in yellow, pink and blue respectively in the chart below.

[Click on any chart to magnify.]

Chart of Beer Advocate's Beer Styles

For clarification, the difference between ales and lagers is generally based on the type of yeast used to make the beer.  Ales are fermented with what is called “top-fermenting yeast” and are typically fermented at warmer temperatures, whereas lagers are fermented at colder temperatures with “bottom-fermenting yeast.”

“Hybrid beers” sometimes refer to both ales that are fermented at colder temperatures and lagers that are fermented at warmer temperatures.  However, BeerAdvocate seems to use the term “hybrid” to refer to beer styles that could be fermented with ale or larger yeast, specifically “Fruit/Vegetable Beer”, “Herbed/Spiced Beer”, and “Smoked Beer.”

As shown in the chart above, the main “ale styles” and “lager styles” categories are further sub-categorized primarily by the country in which a particular beer style originated.

For example, under the “ale styles” category, we find the sub-category of “Irish Ales” under which the following beer styles are listed:

⋅ Irish Dry Stout
⋅ Irish Red Ale

When a given commercial beer is reviewed on BeerAdvocate, that beer will always be associated with a given beer style.  For example, if one were to review “Guinness Draught,” it would be associated with the “Irish Dry Stout” style of beer.

The Current Beerscape by the Numbers

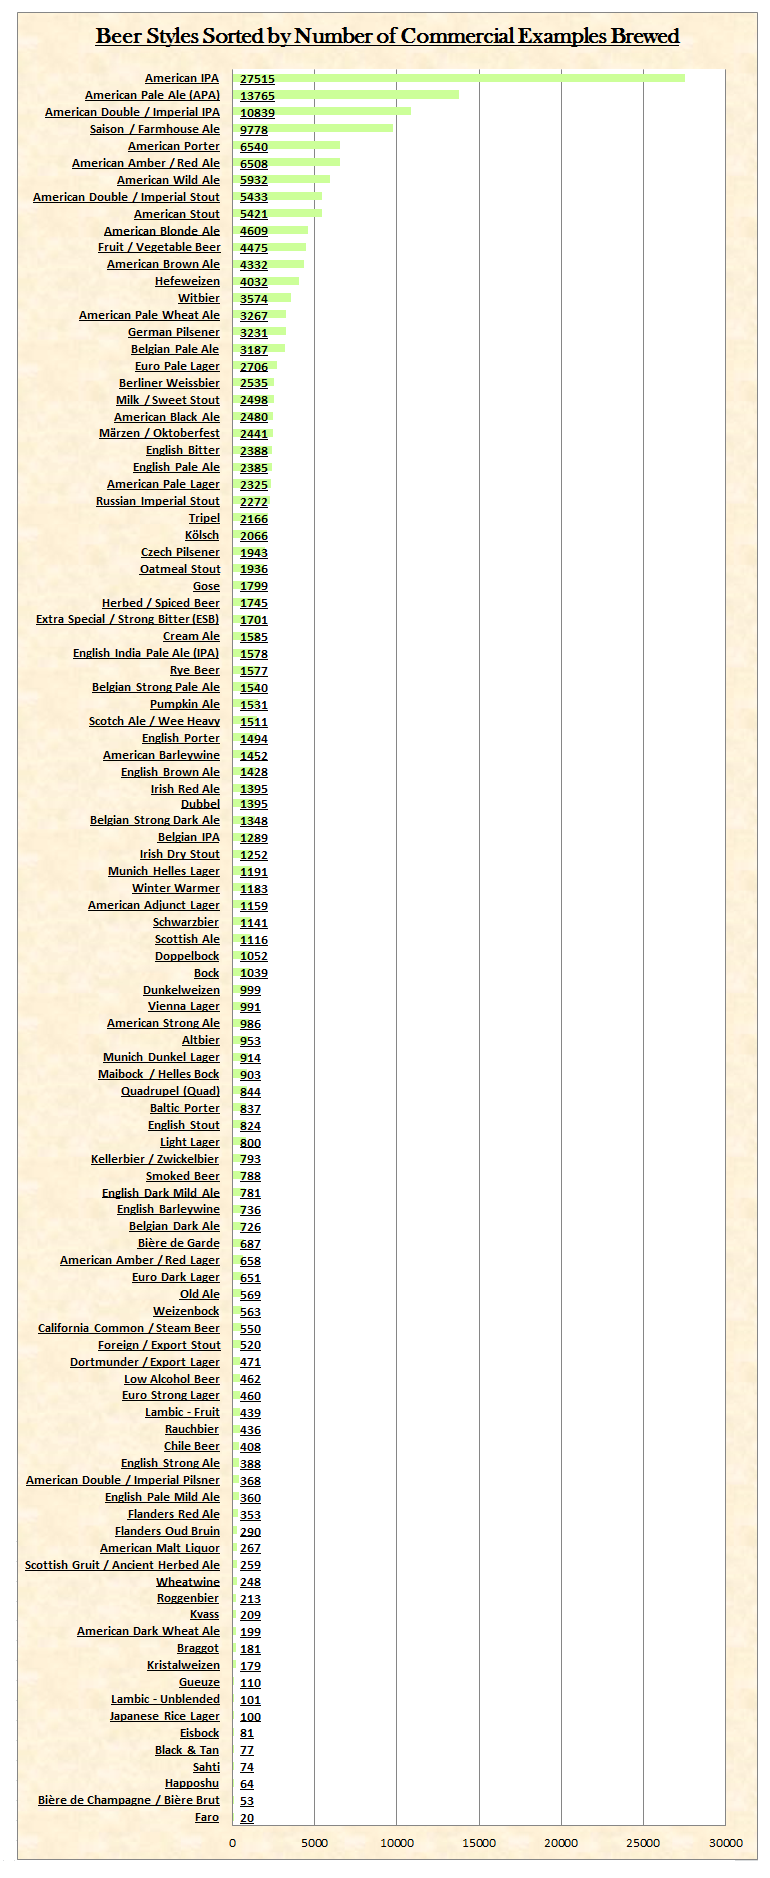
Interested to gauge the current landscape of beer styles and their popularity, we took a quick look at the total number of commercial beers listed under a given beer style on BeerAdvocate’s website.  First we reviewed the list of beer styles arranged in order of the greatest number of commercial examples of a given style.

BeerAdvocate Beer Styles Sorted by Number of Commercial Examples

The chart above lists 104 different beer styles with a grand total of 210,023 different commercial examples of those beer styles.  By far, American IPA is the most popular beer style in the world in terms of commercial examples brewed (27,515).   Rounding out the bottom of the list sits the sweet and sour Belgian Lambic style Faro with only 20 commercial examples to its name.

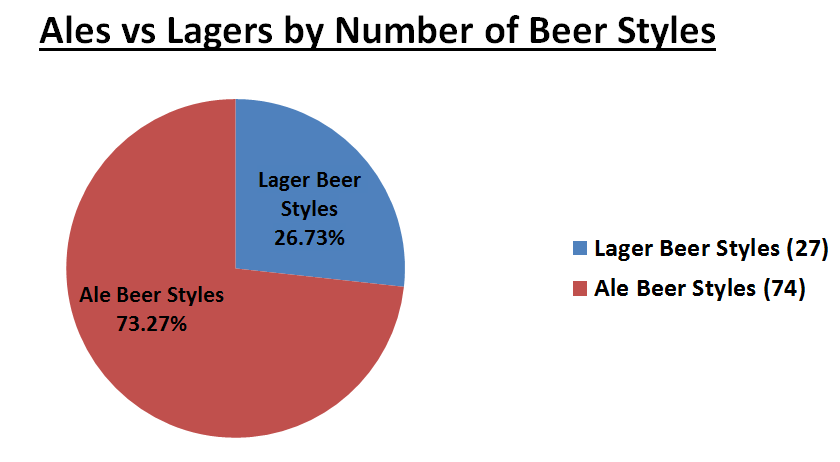
To get a big-picture view of things, we next take a look at how popular lagers are compared to ales both by number of total beer styles in each category and by the number of total commercial examples listed under those categories.  (The following two charts exclude hybrid beer styles as defined by BeerAdvocate.)

Ales vs Lagers by Number of Beer Styles

The chart above shows that there are in total 27 different kinds of lager style beers (26.73%), and 74 different kinds of ale style beers (73.27%).  And while lager styles make up only about a quarter of all beer styles compared to ale styles, it should be noted that one particular style of lager, namely American Adjunct Lager, dominates all other beer styles in terms of global production by volume.

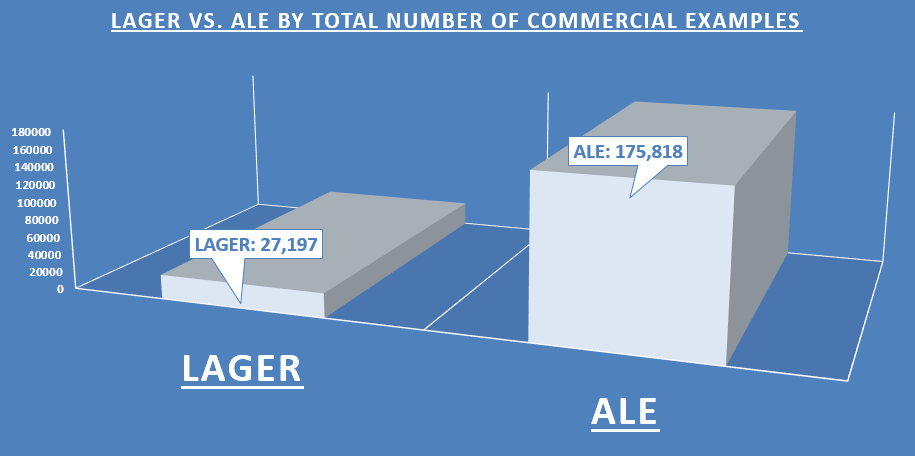
The chart below takes a closer look at lagers and ales, and indicates that there are 27,197 different commercial examples of lager beer (13.39% of all commercial examples), and 175,818 examples of ale beer (or 86.60% of all commercial examples).

Lagers vs. Ales by Total Number of Commercial Examples

Part of the dominance of ale type beers over lagers may have to do with the fact that commercial lagers typically take longer to produce, and are therefore more cost-intensive as compared to most ales.

The Top 10 Beer Styles by Commercial Example

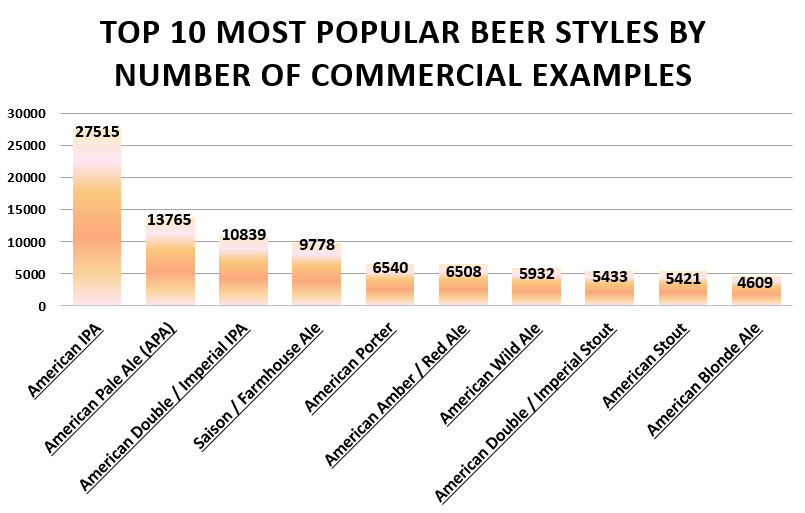
The chart below shows the top 10 most popular beer styles by the number of commercial examples listed on BeerAdvocate.  Again, American IPA dominates the beerscape with 27,515 commercial examples produced, outpacing its next closest rival, American Pale Ale, by a whopping 13,750 commercial examples.

The Top 10 Most Popular Beer Styles by Number of Commercial Examples

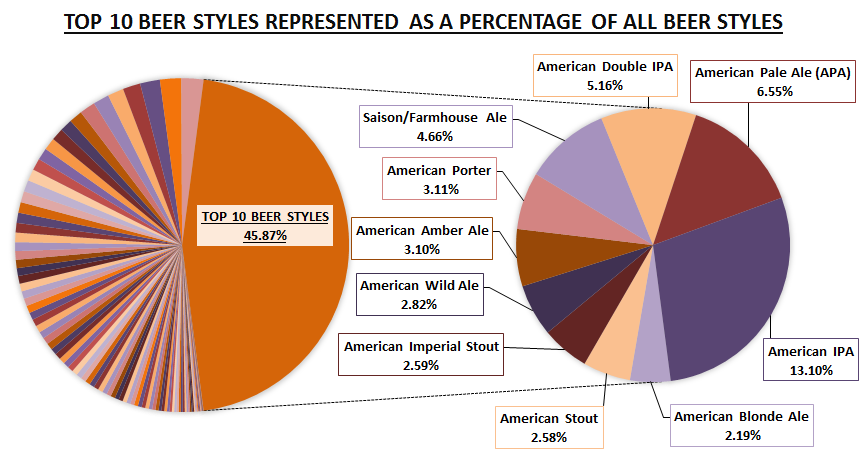
The chart below takes a closer look at the top 10 most popular beer styles with the pie chart on the left representing all 104 beer styles, and the chart on the right showing a magnified section of the top 10 beer styles.

The Top 10 Beer Styles Represented as a Percentage of All Beer Styles

Interestingly, the chart above shows that the 10 most popular beer styles comprise nearly half (45.87%) of all beer styles, including hybrids.  To put it another way, of all the 210,023 commercial examples of beer listed on BeerAdvocate, 96,340 belong to only ten different beer styles, suggesting that although there is a great diversity of beers styles (104 listed styles), there are much fewer commercial examples of this diversity actually produced.

Also of note, the data above reflects that 9 out of 10 of the top 10 beer styles are American beer styles.

To attempt to explain this seemingly lopsided beerscape leaning in favor of American beer styles, let’s consider a few more data points including beer style data and analysis per country to see if American styles are simply crushing it, or if this is all just a numbers game.

Next Page ->

Brewing with Old Yeast vs. New Yeast – Pt. 1

Yeast can be the most influential ingredient in beer, and many brewers often take special care to provide ideal conditions for their yeast in order to attempt to produce excellent beer and avoid certain yeast-derived off-flavors. Likewise, brewers often concern themselves with pitching yeast prior to its “best before” date and also trying to ensure an appropriate yeast cell count for a given batch of wort.

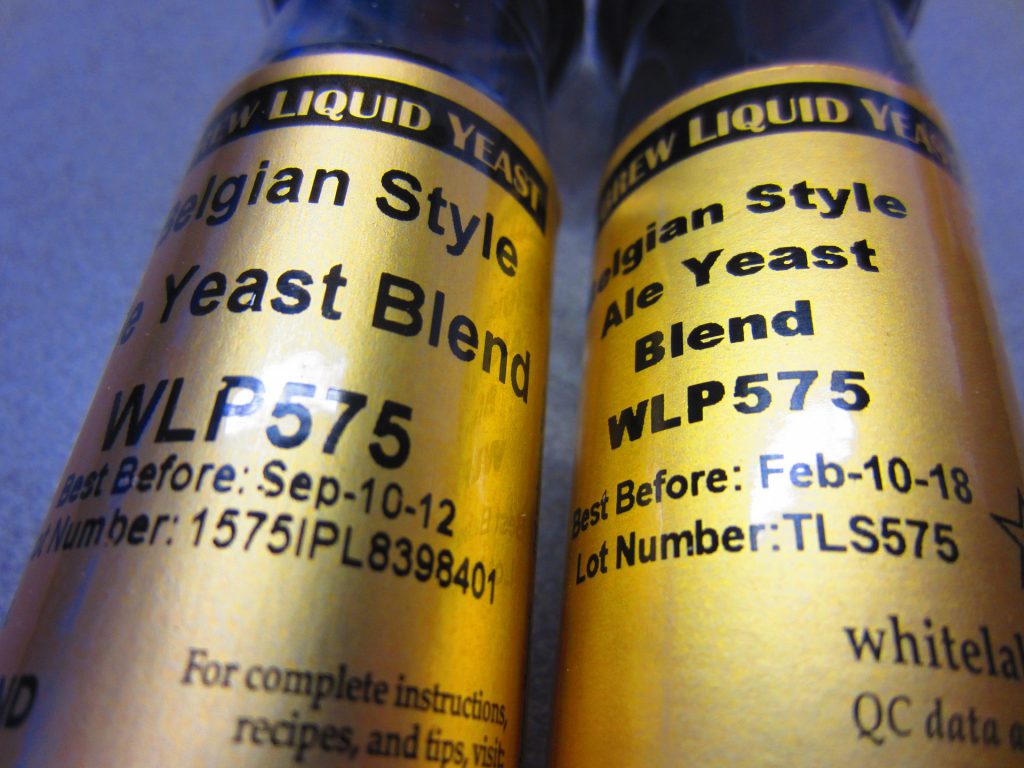
Curious as to how yeast beyond its “best before” date would perform, a 10 gallon batch of wort was brewed and split into two 5 gallon vessels, one batch was inoculated with one vial of yeast pitched prior to its “best before” date, and the other batch was pitched with the same variety of yeast that had exceeded its “best before” date by approximately 5 ½ years.

Old Yeast vs New Yeast.

The particular yeast tested in this experiment was White Labs Belgian Style Ale Yeast Blend WLP 575, one vial with a “best before” date of Sep. 10th, 2012, and the other vial with a “best before” date of Feb. 10th, 2018. Both vials of yeast had been stored at approximately 37 °F (2.78 °C).

[Note: The manufacturing date of White Labs yeast is said to be four months prior to the “best before” date listed on the packaging.]

Essentially, two things are being tested here:

1. Can enough (or any) viable (live) yeast cells survive after being in a vial for nearly six years in order to ferment wort?
2. Assuming wort can be fermented with six-year-old yeast, will pitching the reduced amount of viable yeast affect the final character of the beer enough to be identified in a taste test when compared to a similar beer made with newer yeast and thus a higher pitching rate?

Experiment Considerations

Being that Belgian yeast is being tested, it seemed only fitting that a Belgian style wort should be brewed. But what kind of Belgian wort would be best so as to minimize stress on the yeast and provide the best possible chance of growth, especially considering that the almost six-year-old vial of yeast might not have much if any viable yeast?

After careful scientifical consideration, it was concluded that a Belgian Dark Strong ale recipe with a starting gravity of 1.116 would be a good testing ground for old yeast, because as Euclid’s 6th Postulate clearly states: “Go Big or Go Home.”  Also, esters and other compounds which develop during the yeast’s growth phase may be more noticeable and therefore easier to detect in a beer of higher gravity that’s been fermented with under pitched Belgian yeast.

Of course there are some more serious dangers of under pitching yeast including the potential for other microorganisms to infect the beer, and the possibility of a stuck fermentation with the resulting under-attenuated beer.

Not to be deterred, the next order of business was to determine what the potential viability of the yeast was based on its age, and also what an appropriate cell count estimate might be for a wort with a starting gravity of 1.116.

Fortunately, online calculators have been designed for just this purpose.

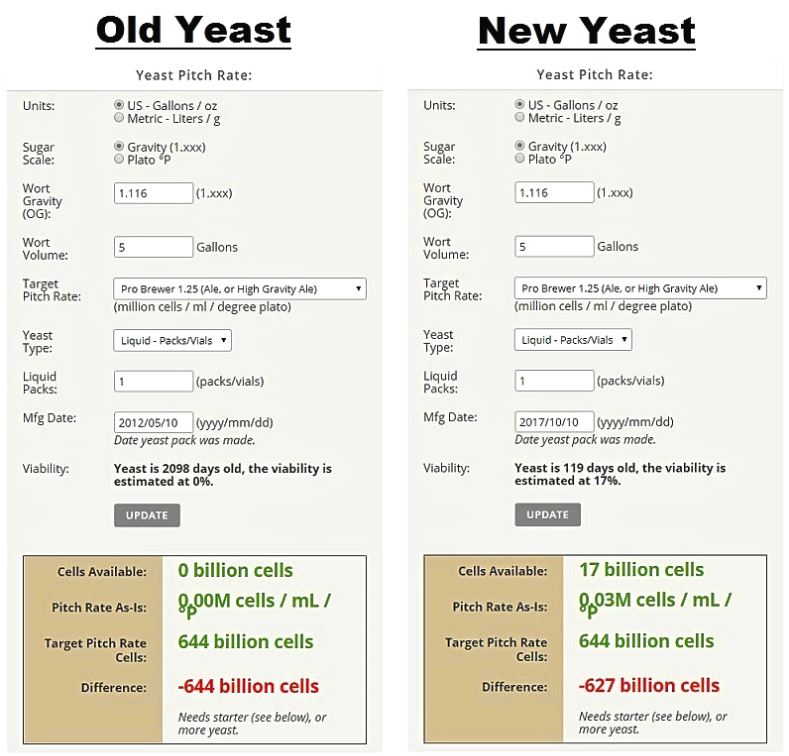
One such program is the Yeast Pitch Rate and Starter Calculator from the website www.brewersfriend.com where the tagline is “brewing with total confidence.” After entering the details of the age of the yeast and the starting gravity of the wort, the viability of the yeast in the vial was estimated to be at approximately 0%. In other words, the calculator reassuringly estimated that 0% of the yeast would be alive. Based on this figure, the program further suggested that the pitch rate of the old yeast would be just a tad bit short… by about 644 billion cells… which is to say we are under the recommended pitch rate by 100%.

For good measure, the viability and suggested pitch rate for the new yeast was also calculated, and the program indicated that the viability of the yeast was about 17%, and thus the recommended pitch rate of the new yeast would be a little short as well, but only by 627 billion cells.

Viability of Old Yeast vs. New Yeast

Brewer's Friend: Brewing with Total Confidence

Armed with this information, the requisite “total confidence” was obtained in order to move forward with the experiment.

Process

In order to keep variables as consistent as possible, no yeast starters were made for either the old or new yeast.

One 10 gallon batch of beer was brewed, chilled to 64 °F (17.78 °C), split into two vessels with one vessel receiving the new yeast, and the other vessel the old yeast, the vessels were shaken vigorously for one minute to oxygenate, and finally placed into a temperature controlled refrigerator set to 68 °F (20 °C) on January 29th, at 2:00 AM.

Predictions

1. The old yeast might make beer. Or it might not.
2. The under pitched new yeast will probably make beer, but maybe it won’t.

Observations

1. Turns out that both predictions from above were correct!
2. The beer with one vial of new yeast began to form a krausen approximately 72 hours after inoculation.
3. The beer with one vial of 6 year-old-yeast began to form a krausen approximately 78 hours after inoculation.
4. Both the beer with the old yeast and new yeast exhibited vigorous fermentation and a similar-looking krausen, however the beer with the old yeast was more vigorous, pushing krausen through the airlock.
5. On day 8, airlock bubbling slowed dramatically, and by day 9, it had stopped. By day 10, the krausens of both beers had still not fallen.
6. A sniff check on day 9 revealed that the aroma of the beer with the new yeast was more fruity and complex, whereas the beer with the old yeast exhibited more of a generic overstated yeast character, and not as much of the complex fruity character typical of some strains of Belgian yeast.
7. A sniff check on day 10 revealed that the aroma of the beer with the new yeast maintained its same fruity complexity, but the beer with the old yeast had toned down some of its predominant generic yeast character, and begun to develop a more complex and better integrated yeast-to-beer balance.

Further Predictions

1. The beer with one vial of new yeast will attenuate to within 5 gravity points of the beer with the old yeast, give or take 20 gravity points.
2. The two beers will be repeatedly distinguishable based on a triangle taste test performed by 10 supertasters (significance will be reached with a p-value of <0.05). However, a subsequent and more advanced trapezoid test will reveal that statistical significance was not reached by a population size of 20 non-supertasters.


Hi, I’m Dan: Beer Editor for Beer Syndicate, Beer and Drinking Blogger, Beer Judge, Gold Medal-Winning Homebrewer, Beer Reviewer, American Homebrewers Association Member, Shameless Beer Promoter, and Beer Traveler.
Powered by WordPress & Theme by Anders Norén